
Use this free PV calculator to get precise yield, savings, and payback for your exact roof in 5 minutes. No sign-up — results stay with you.
Calculate My Savings — Free & IndependentA free calculator is only as good as the data and physics behind it. Here's exactly what goes into every PV Freund calculation — and why it lands within ±10% of your real meter reading.
PV Freund uses the same satellite weather data that professional energy consultants use — with 4 km grid resolution and an 8,760-hour annual simulation. Accurate to ±10%.
The precision was always possible. The price is a choice.
There is no gate. Your results appear directly in your browser — no email, no account, no final form. What you see is yours immediately.
A gate means someone wants something from you. We don't.
Your inputs are sent to our server only to run the calculation — like a search query. Nothing is saved, logged, or shared afterwards. The only record of your results is the PDF you choose to download yourself.
Storing data costs money. We have no reason to spend it.
Manual calculations miss the factors that matter most. Here's what changes when you simulate instead of estimate.
Six steps. No surprises. Nothing you need to prepare in advance.
Type your address and the map zooms to your roof. No account, no verification step.
Your annual electricity usage. Add EV or heat pump if you have them — or skip and use the default.
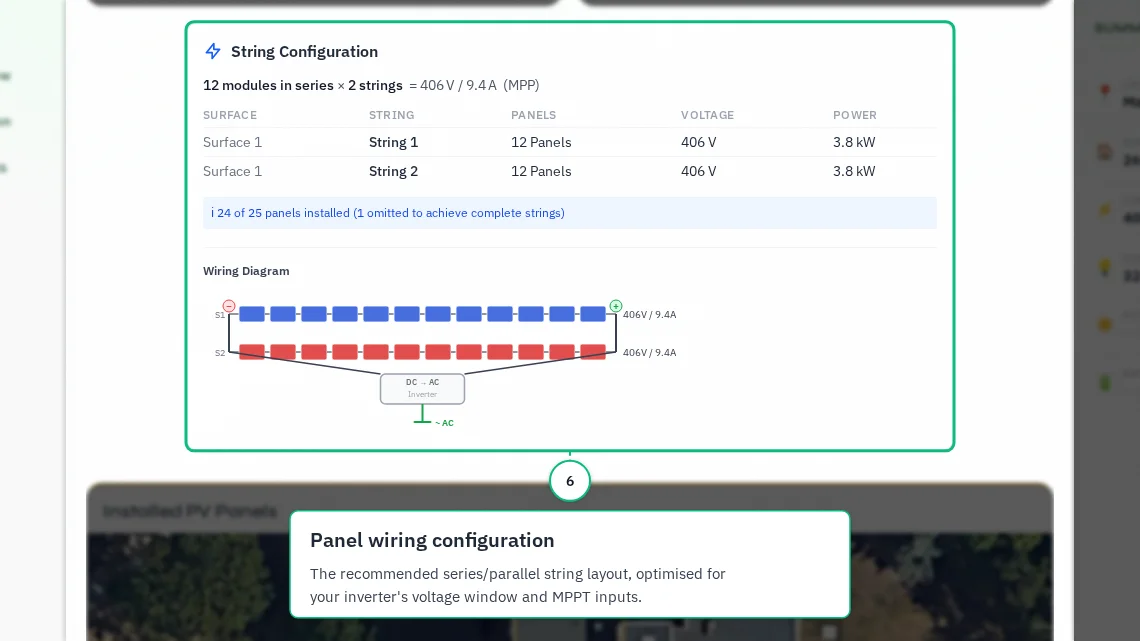
Maximise savings, self-sufficiency, or payback speed — or set a custom system size and explore manually.
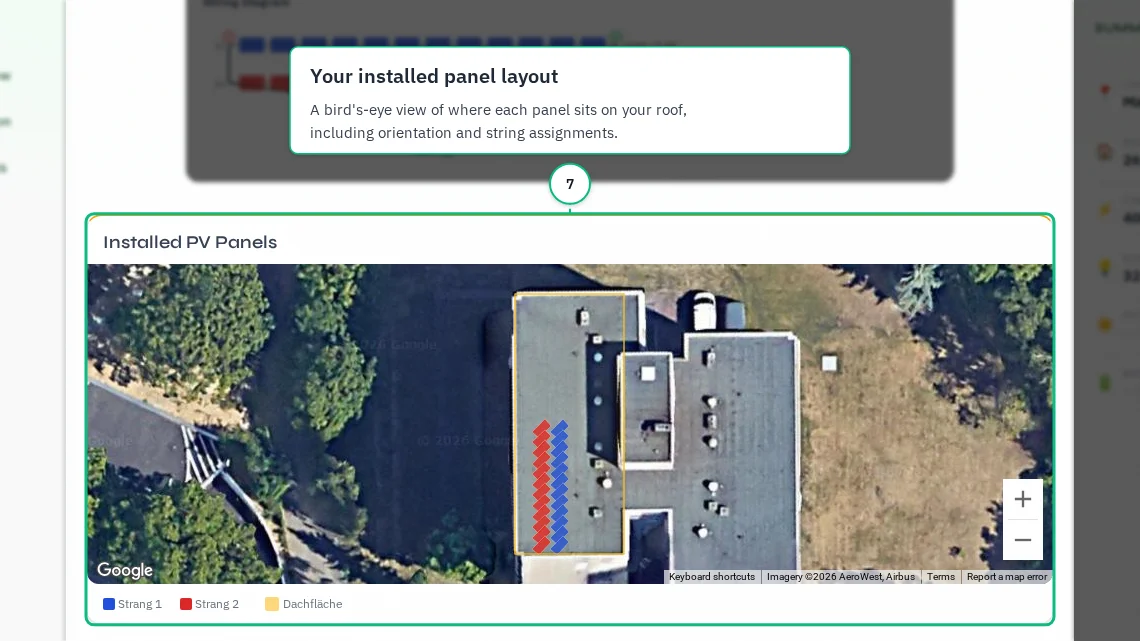
Outline your roof surfaces on the satellite map. Add any trees or buildings that cast shade — specify their height.
Grid tariff and feed-in rate. Sensible defaults are pre-filled — skip what you don't know.
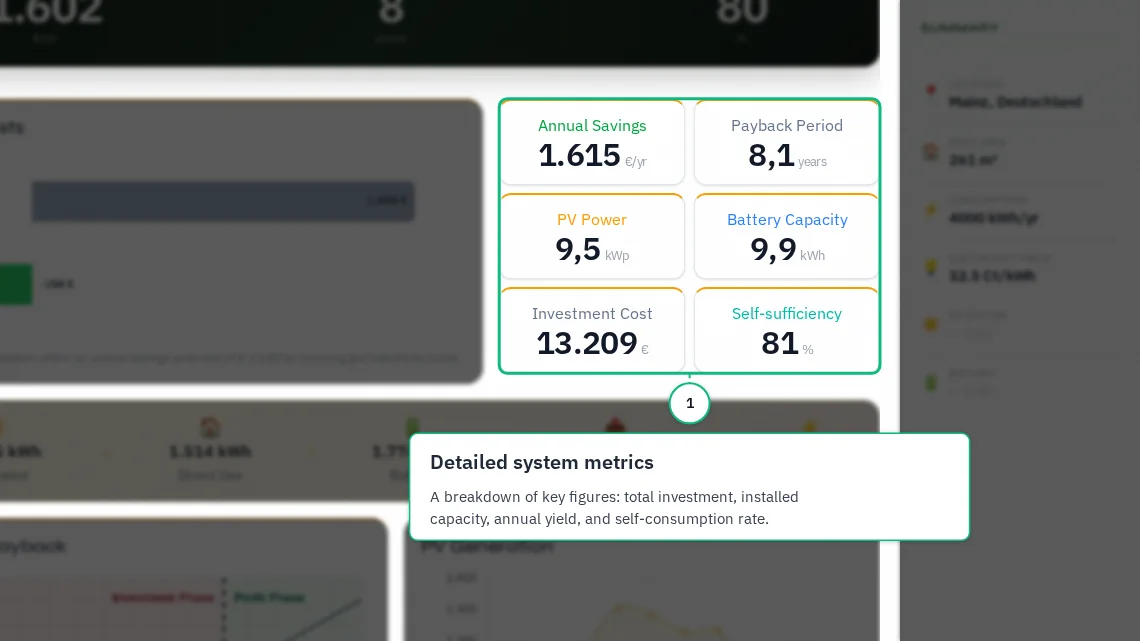
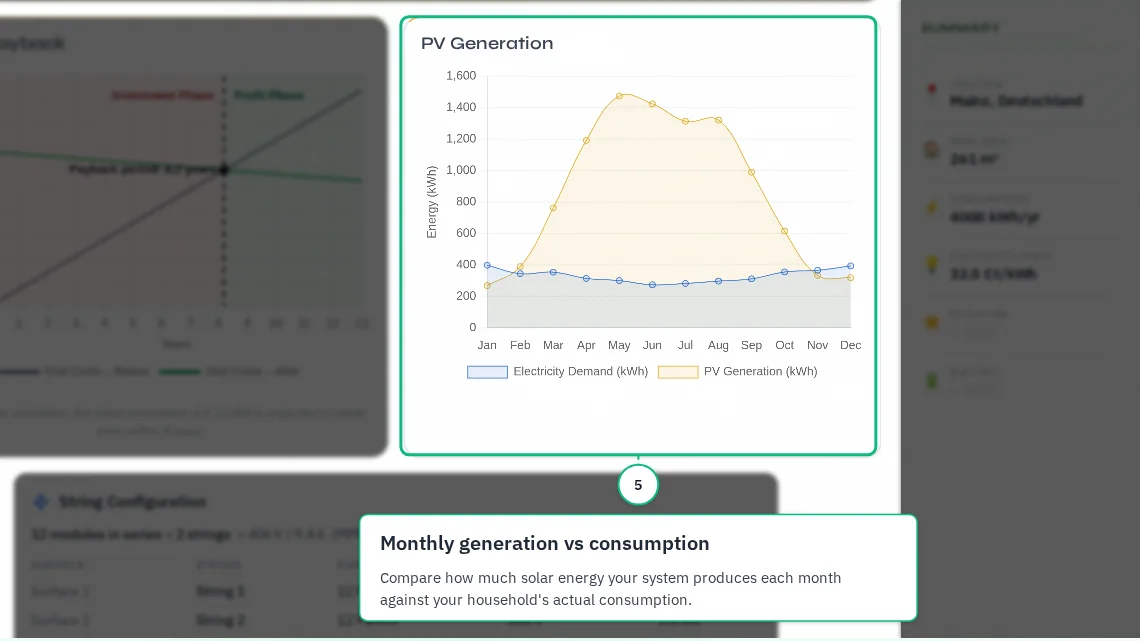
Yield, savings, payback period, and self-sufficiency — in your browser, immediately. No email required.
A real result from PV Freund — the same output you'll get for your own roof.
±10% accuracy doesn't happen by accident. Here's exactly what goes into every calculation.
We use satellite measurements taken directly above your roof, not the nearest weather station which could be 50 km away. 30 years of historical data at 4 km resolution. Your forecast reflects what the sky above your house actually does.
Every one of the 8,760 hours in a year is simulated individually — not monthly averages that hide seasonal variation. Your load profile is matched hour by hour to solar production, giving a realistic self-consumption rate rather than an optimistic guess.
Roof pitch, orientation, and azimuth are calculated per surface — not approximated with a generic "south-facing 35°" assumption. The angle sunlight hits your panels determines both yield and when that yield occurs during the day.
Panels lose efficiency when they overheat. On a hot summer day, panels run 40–50°C above air temperature. We factor in local temperature history for your area so summer output isn't overstated the way simple calculations often are.
Ignoring obstacles leads to systematic overestimation. Draw any shading objects on the map and specify their height. PV Freund calculates for each of the 8,760 hours whether the sun is blocked — and reduces yield at module level accordingly.
Knowing the limits of a tool is part of trusting it. Here's where PV Freund stops and real-world variability begins.
Individual years can be up to +10% sunnier or −10% cloudier than the 30-year mean. Historical averages can't predict next year's sky — actual yield may swing 5–15% above or below forecast.
Bird droppings, pollen, fine dust, and autumn leaves reduce efficiency by 2–5%. In agricultural or industrial areas this can be higher without regular professional module cleaning.
High-quality monocrystalline modules lose ~0.5% of nominal power per year. Real-world savings will be slightly lower in later years than the 25-year forecast shows.
Growing trees and new neighbouring buildings can cast new shadows over a 20–30 year lifespan. A shading analysis is a snapshot — the profile should be rechecked periodically.
Most PV calculators stop at basic yield. PV Freund models the full picture — including the components most installers quote for separately.
Battery storage can raise self-sufficiency from ~30% to over 70% — if your tariff and usage timing support it. Model whether storage actually pays off for your specific consumption pattern, not just in theory.
learn more →An EV roughly doubles your household consumption — the optimal system size changes significantly when you factor it in. Size your system around charging your car for free and see how it shifts your optimal PV configuration.
learn more →Heat pumps and solar are unusually well-matched — but only when the system is sized to your actual heating demand. Factor in heating demand for a complete energy picture. Sized correctly, they work exceptionally well together.
learn more →Last updated:


